Observability
Talisman Platform observes the integrations it runs — no extra agent, sidecar or monitoring stack is required to get started. Every integration Talisman builds is generated with the Apache Camel observability services enabled, and the platform scrapes those endpoints continuously to populate the Dashboard, the Topology view and the project pages.
Observability in Talisman covers four signals:
| Signal | Source | Where you see it |
|---|---|---|
| Health | Camel health checks (/observe/health) |
Dashboard → Operations, project status |
| Metrics | Micrometer / Prometheus scrape (/observe/metrics) |
Dashboard → Operations, Topology badges |
| Runtime state | Camel Dev Console (/q/dev/*) |
Project → Runtime, Trace, Errors |
| Logs | Container and build logs, streamed live | Project → Logs, System → Log |
On top of the technical signals, Talisman Platform adds Business Activity Monitoring (BAM) — business-level events correlated across projects, routes and servers.
Health checks
Every few seconds the platform collects /observe/health?data=true from each running
packaged or dev-mode container (falling back to /q/health for Camel 4.10 runtimes) and
distils the Camel check list into a project-level view:
- Context status — is the Camel context
UP, plus context name and version. - Routes status —
UPunless at least oneroute:*check reportsDOWN. - Consumers status — the same rule for
consumer:*checks. - Errors — for every failing check, the check name and its full
datapayload, so the reason for aDOWNis visible in the UI without opening a terminal.
Health results also drive the platform itself: when a context transitions to UP, Talisman
collects the runtime information for the project (main configuration and the sources the
running container actually loaded). When a container disappears, its health and metrics are
evicted from the cache, so the Dashboard never shows stale green.
Metrics
Talisman scrapes the Prometheus text endpoint (/observe/metrics, falling back to
/q/metrics) of every running container, stores the raw payload, and parses it into a
normalised metric record per project and container.
Both metric naming schemes are recognised automatically:
| Measure | Micrometer | MicroProfile |
|---|---|---|
| In-flight exchanges | camel_exchanges_inflight |
application_camel_context_exchanges_inflight_count |
| Total exchanges | camel_exchanges_total |
application_camel_context_exchanges_total |
| Succeeded | camel_exchanges_succeeded_total |
application_camel_context_exchanges_completed_total |
| Failed | camel_exchanges_failed_total |
application_camel_context_exchanges_failed_total |
Alongside the exchange counters, the following JVM and system measures are collected: heap and non-heap memory (max and used), CPU count, process and system CPU usage, 1-minute system load average, GC pause sum and count, and process uptime.
Exchange metrics are kept per route as well as in total — the routeId label of the
scraped series is preserved — which is what allows the platform to show message counts on
individual nodes in the Topology view, not just for the integration as a whole.
Dashboard
The Dashboard is the platform-wide view and has three tabs:
- Development — projects, commits, team activity and library usage.
- Operations — the live operational picture of the current environment.
- Tasks — the human-in-the-loop inbox.
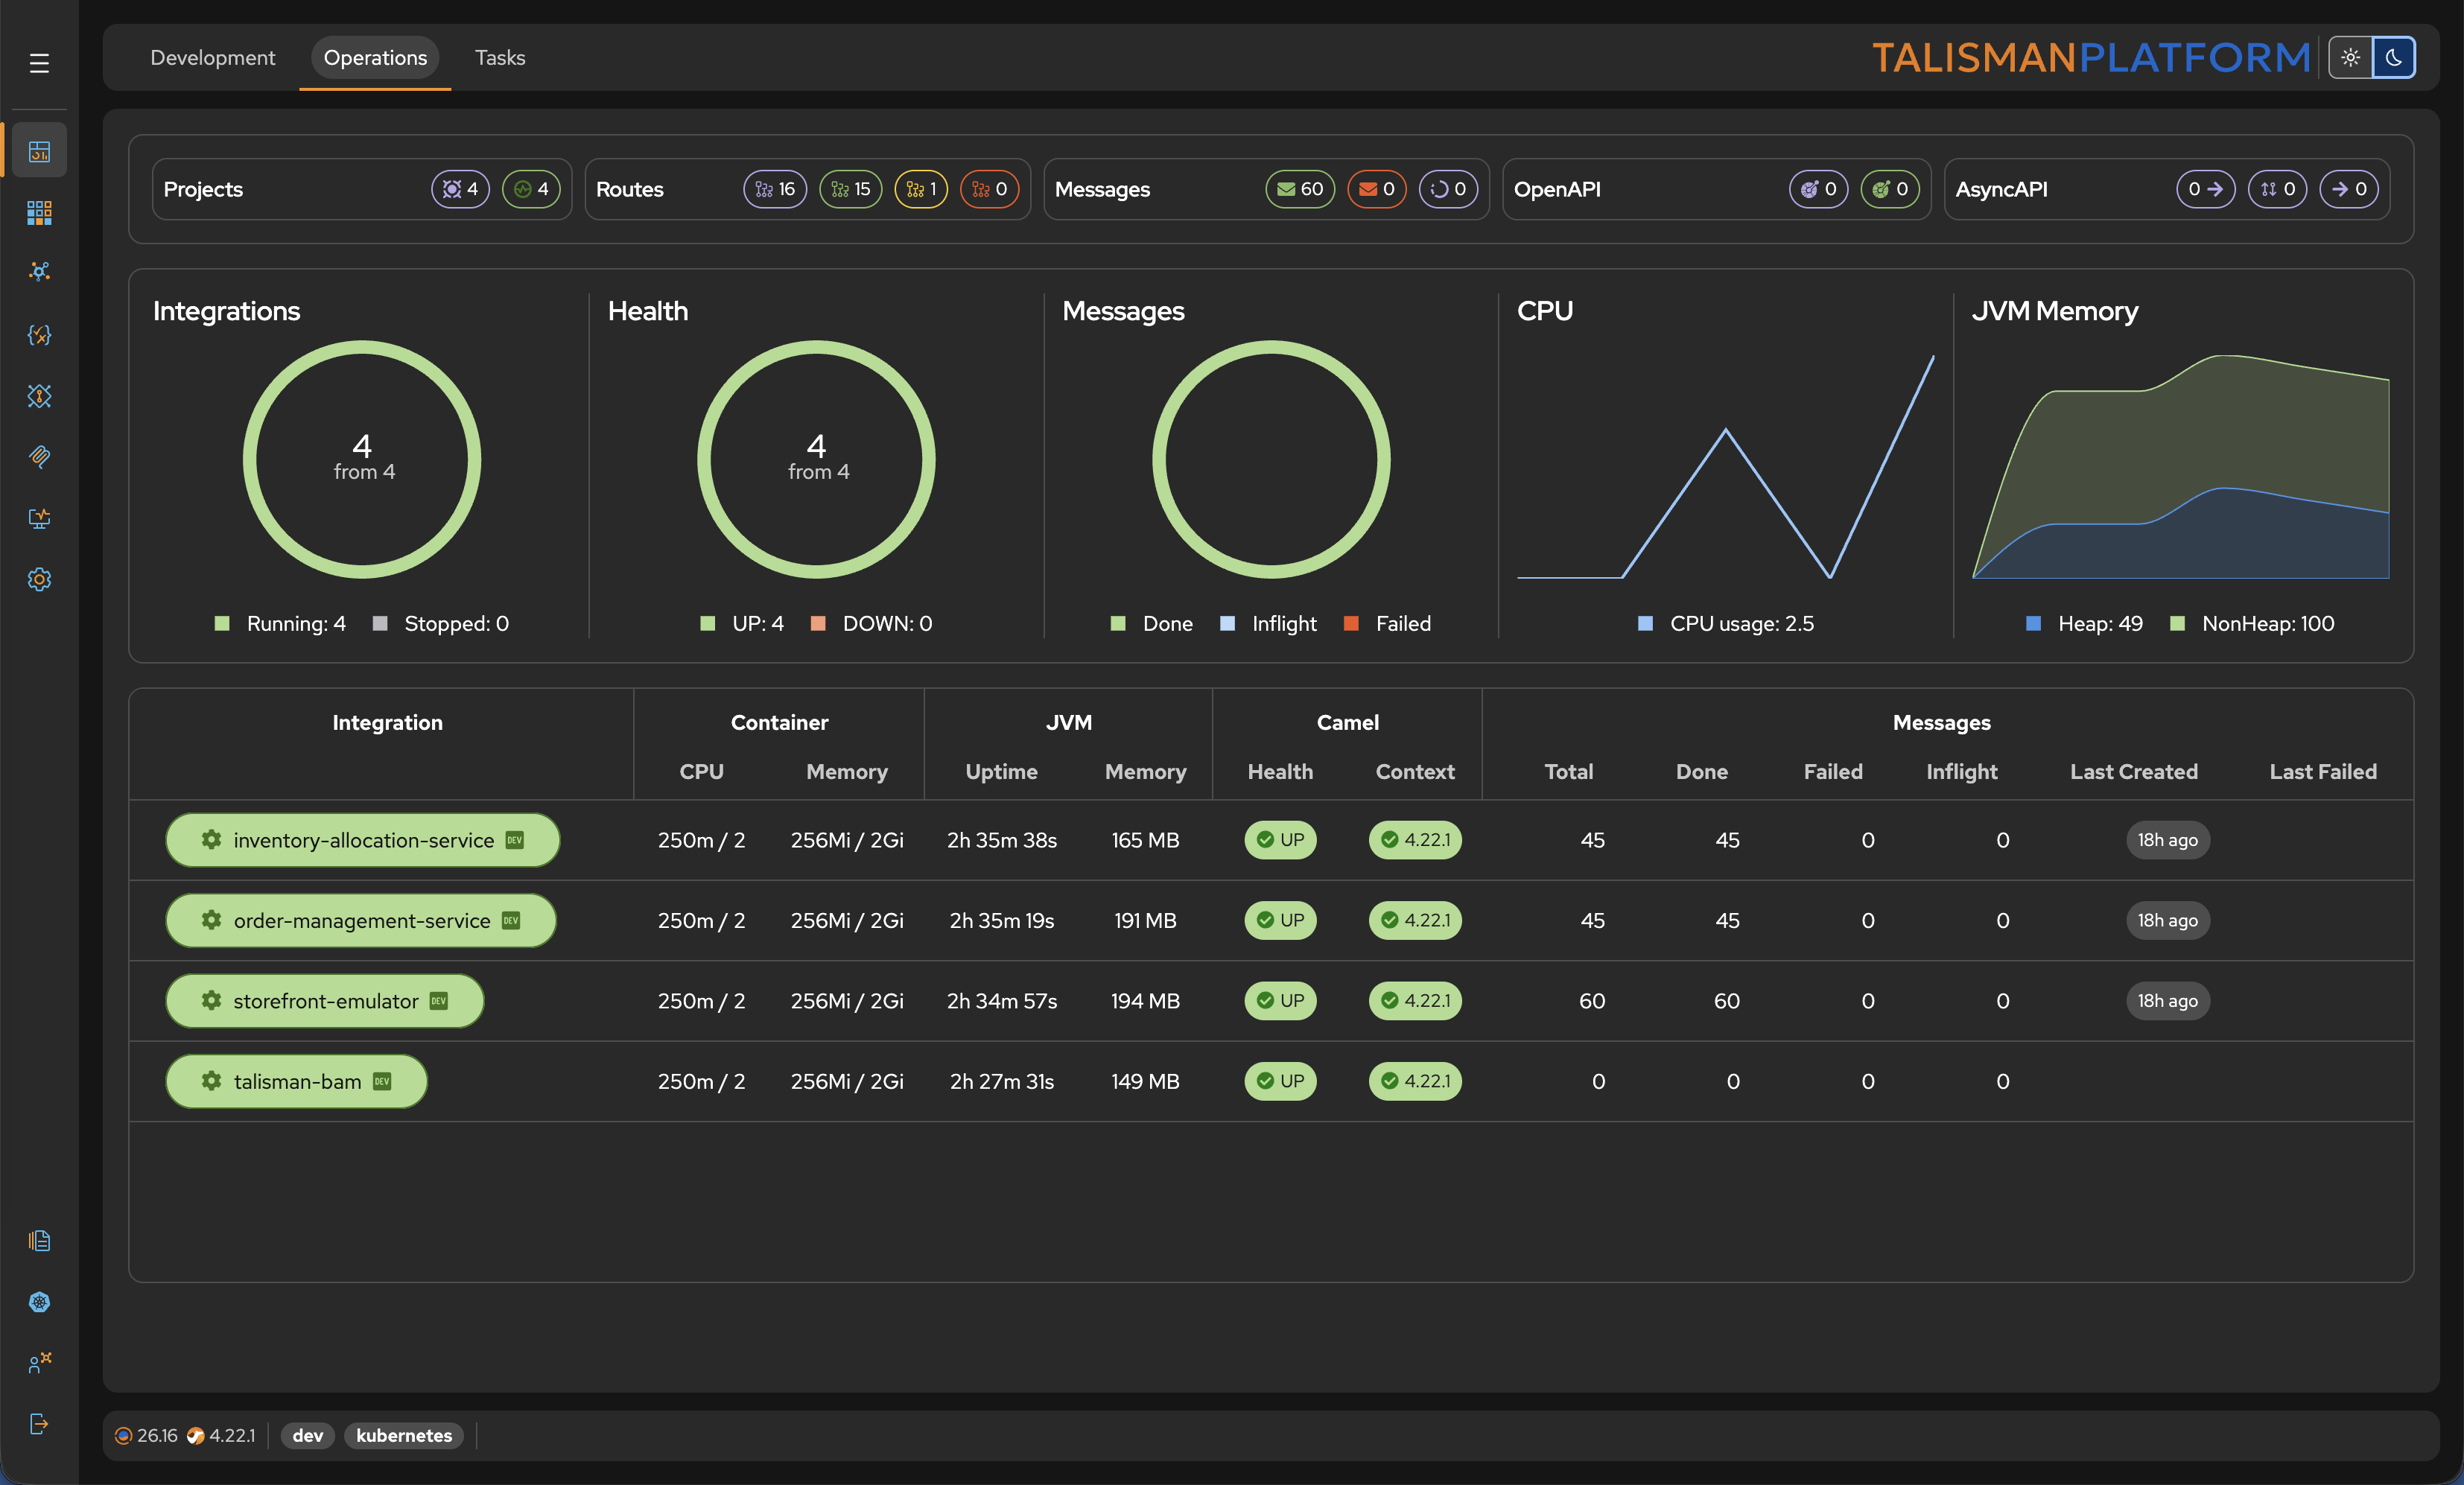
The Operations tab summarises, across all projects in the environment:
- integrations designed and integrations up;
- routes designed, started, suspended and stopped;
- messages succeeded, failed and in flight, plus the last failure time;
- OpenAPI services designed and running, channels, and send/receive operations.
Below the summary, a performance table breaks the same numbers down per project, with exchange charts showing how traffic and failures develop over time. Container actions (start, stop, restart, delete) are available directly from the table, so diagnosis and remediation happen in the same place.
Topology
The Topology view renders the integration landscape — routes, endpoints, REST services, channels and beans — and attaches live counters to the nodes: total, in-flight and failed exchanges. Badges only appear when the counter is non-zero, so a busy topology still reads cleanly and a failing node is visible at a glance.
Because topology is derived from the designed routes and enriched with runtime metrics, it works as both an architecture diagram and a monitoring surface.
Project-level Insight
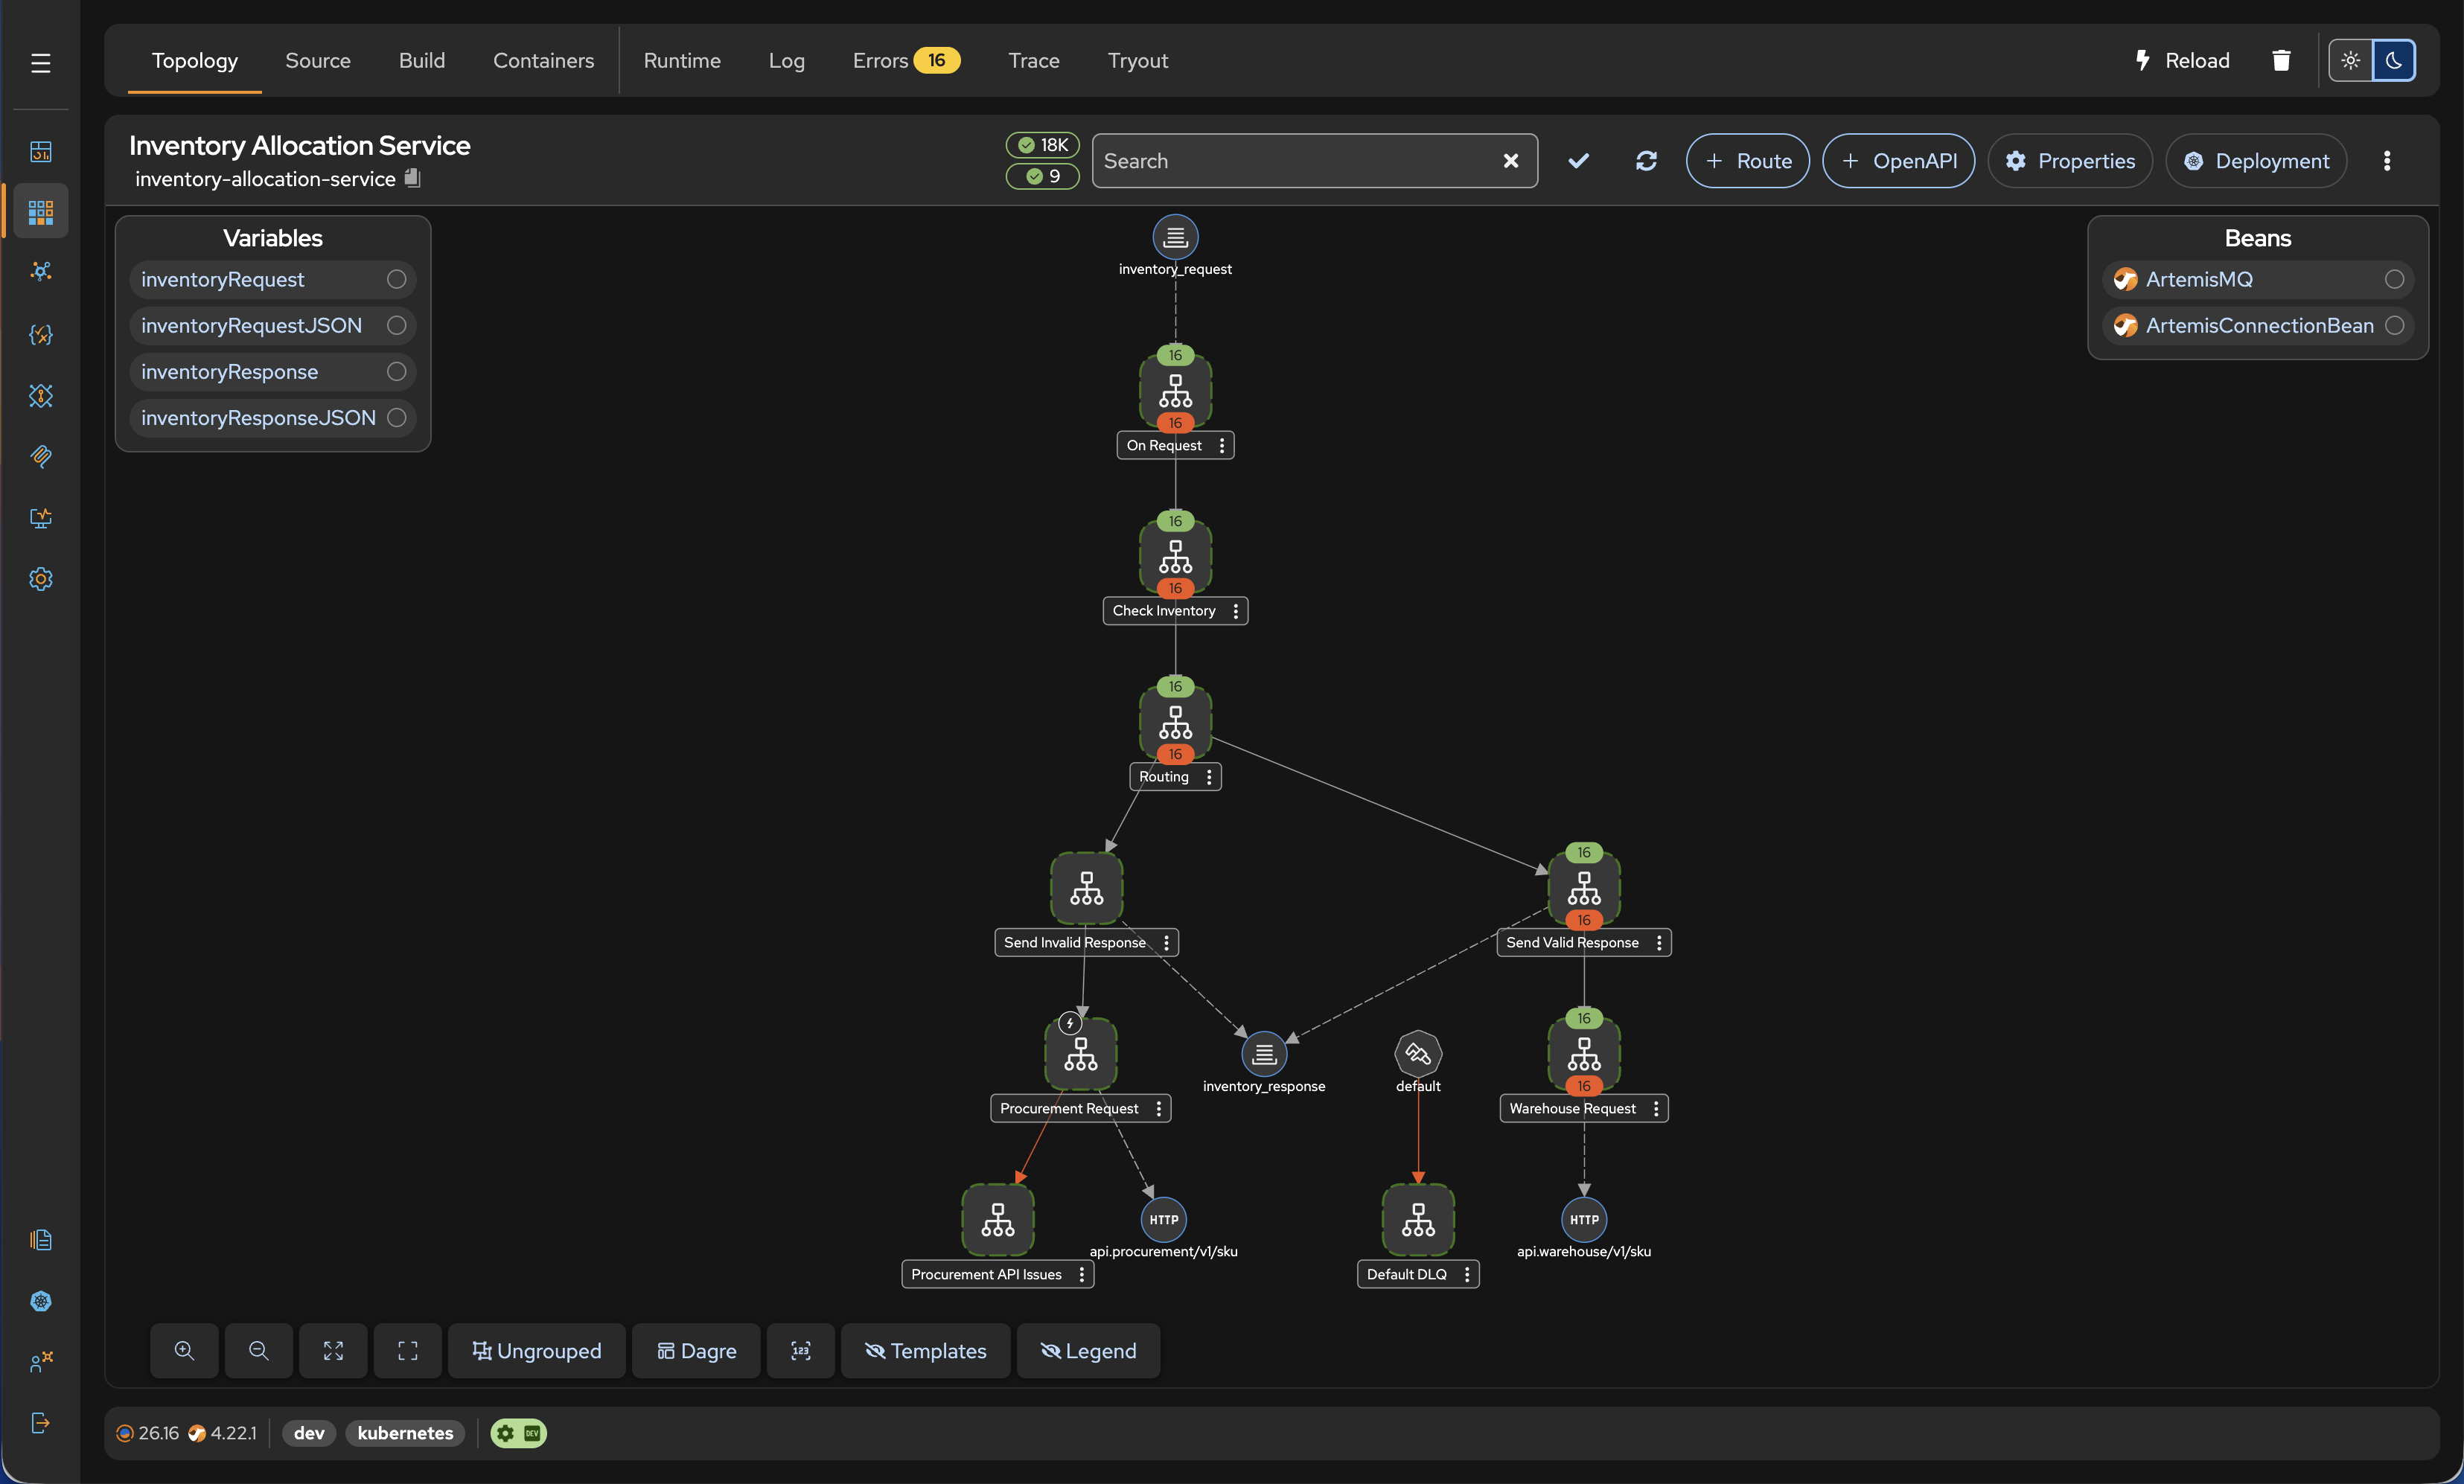
That gives each project:
- Runtime — Camel context information, JVM memory, the route table (with start, stop and suspend actions), HTTP endpoints, threads, resolved dependencies and the effective main configuration.
- Trace — message traces dumped from the running container, listed per exchange and drillable down to the individual route nodes and message bodies/headers.
- Errors — the failures reported by the running integration, with message details.
- Logs — the container log, streamed live.
- Debug — breakpoints, step and resume against a project started in debug mode.
Tracing is deployed in standby mode by default (camel.trace.standby=true), which keeps
the overhead off the hot path until tracing is actually switched on for an investigation.
Log Viewer
Container and build logs are streamed to the browser over Server-Sent Events. The same viewer is used in three places: the project Logs tab, the project build output, and the System → Log tab for platform and infrastructure containers.
Streaming is push-based: there is no polling interval to tune, and the log follows the container from the moment it starts.
Error Registry
Talisman features a built-in Error Registry viewer that surfaces detailed snapshots of exceptions that occur during message routing. Instead of combing through raw logs, developers can use the viewer to inspect the detached exchange data — including the message body, headers, variables, and properties — captured at the exact moment of failure.
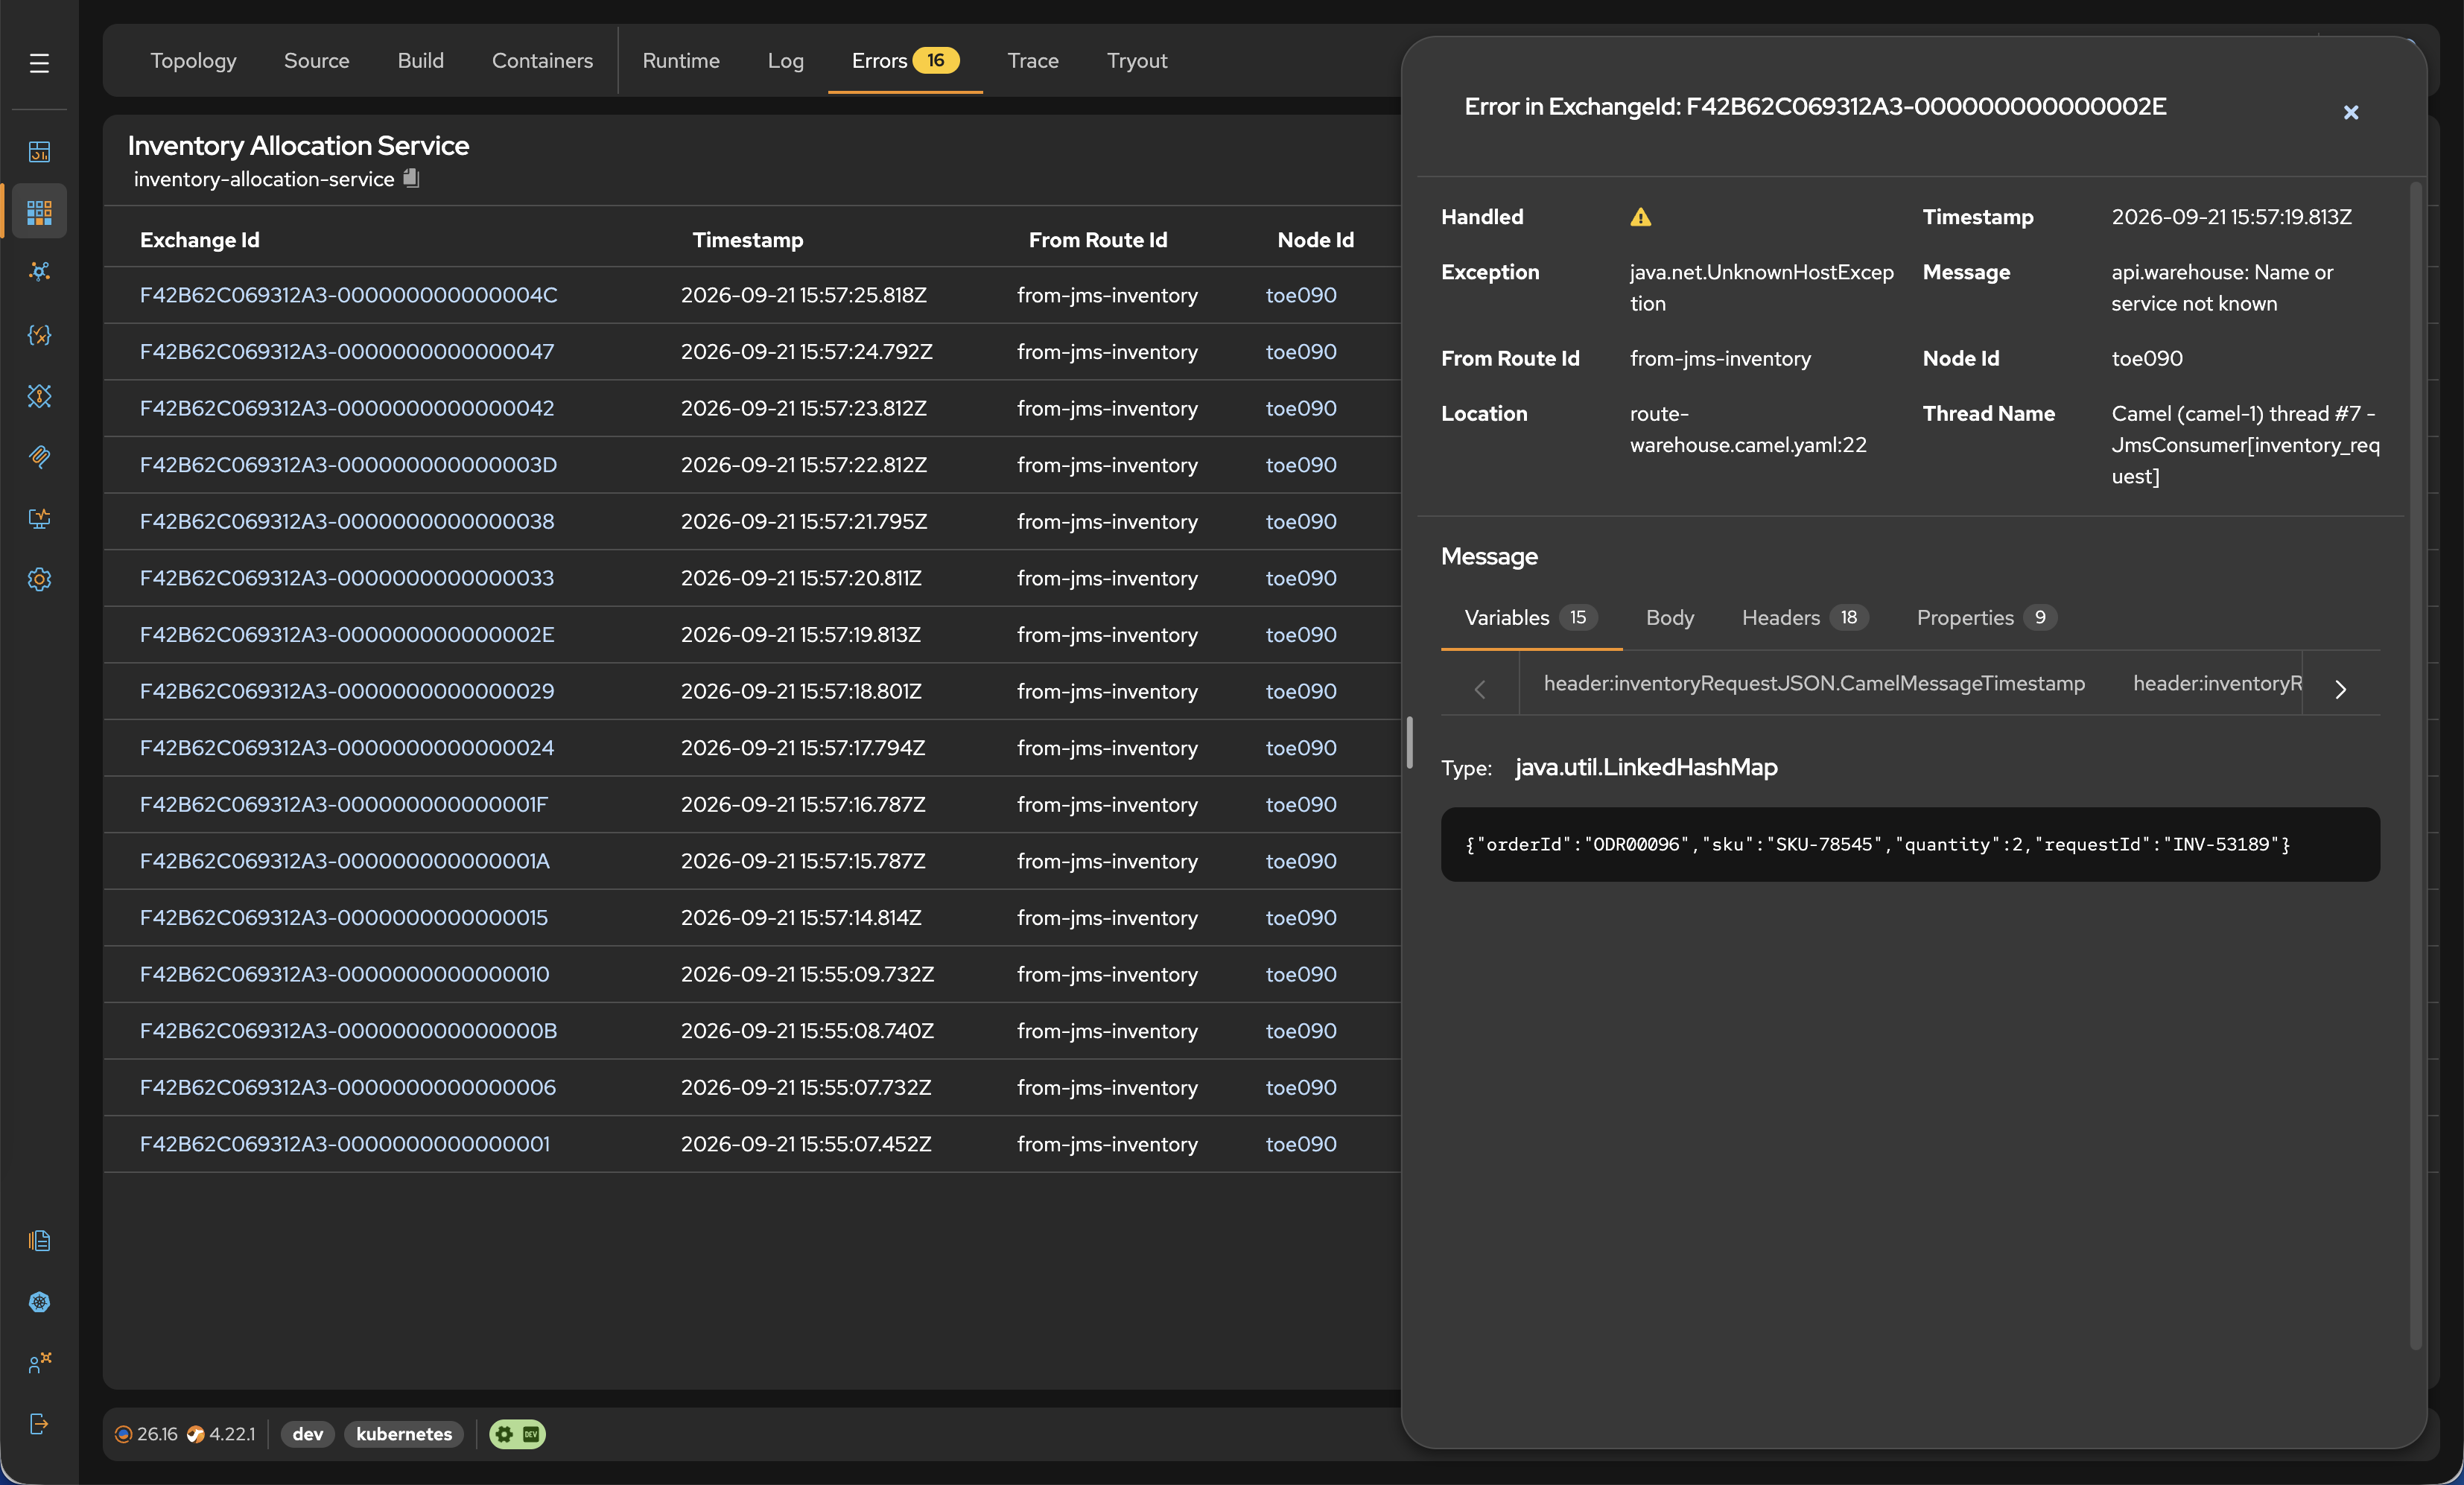
Crucially, the viewer displays the full message history trace and provides a direct link to the specific processor node where the error happened, allowing you to pinpoint the exact step of the failure and resolve integration issues instantly.
Business Activity Monitoring
BAM is the Enterprise answer to the question technical metrics cannot answer: what happened to this order? Instead of counting exchanges, BAM records named business events and correlates them across projects, routes and servers.
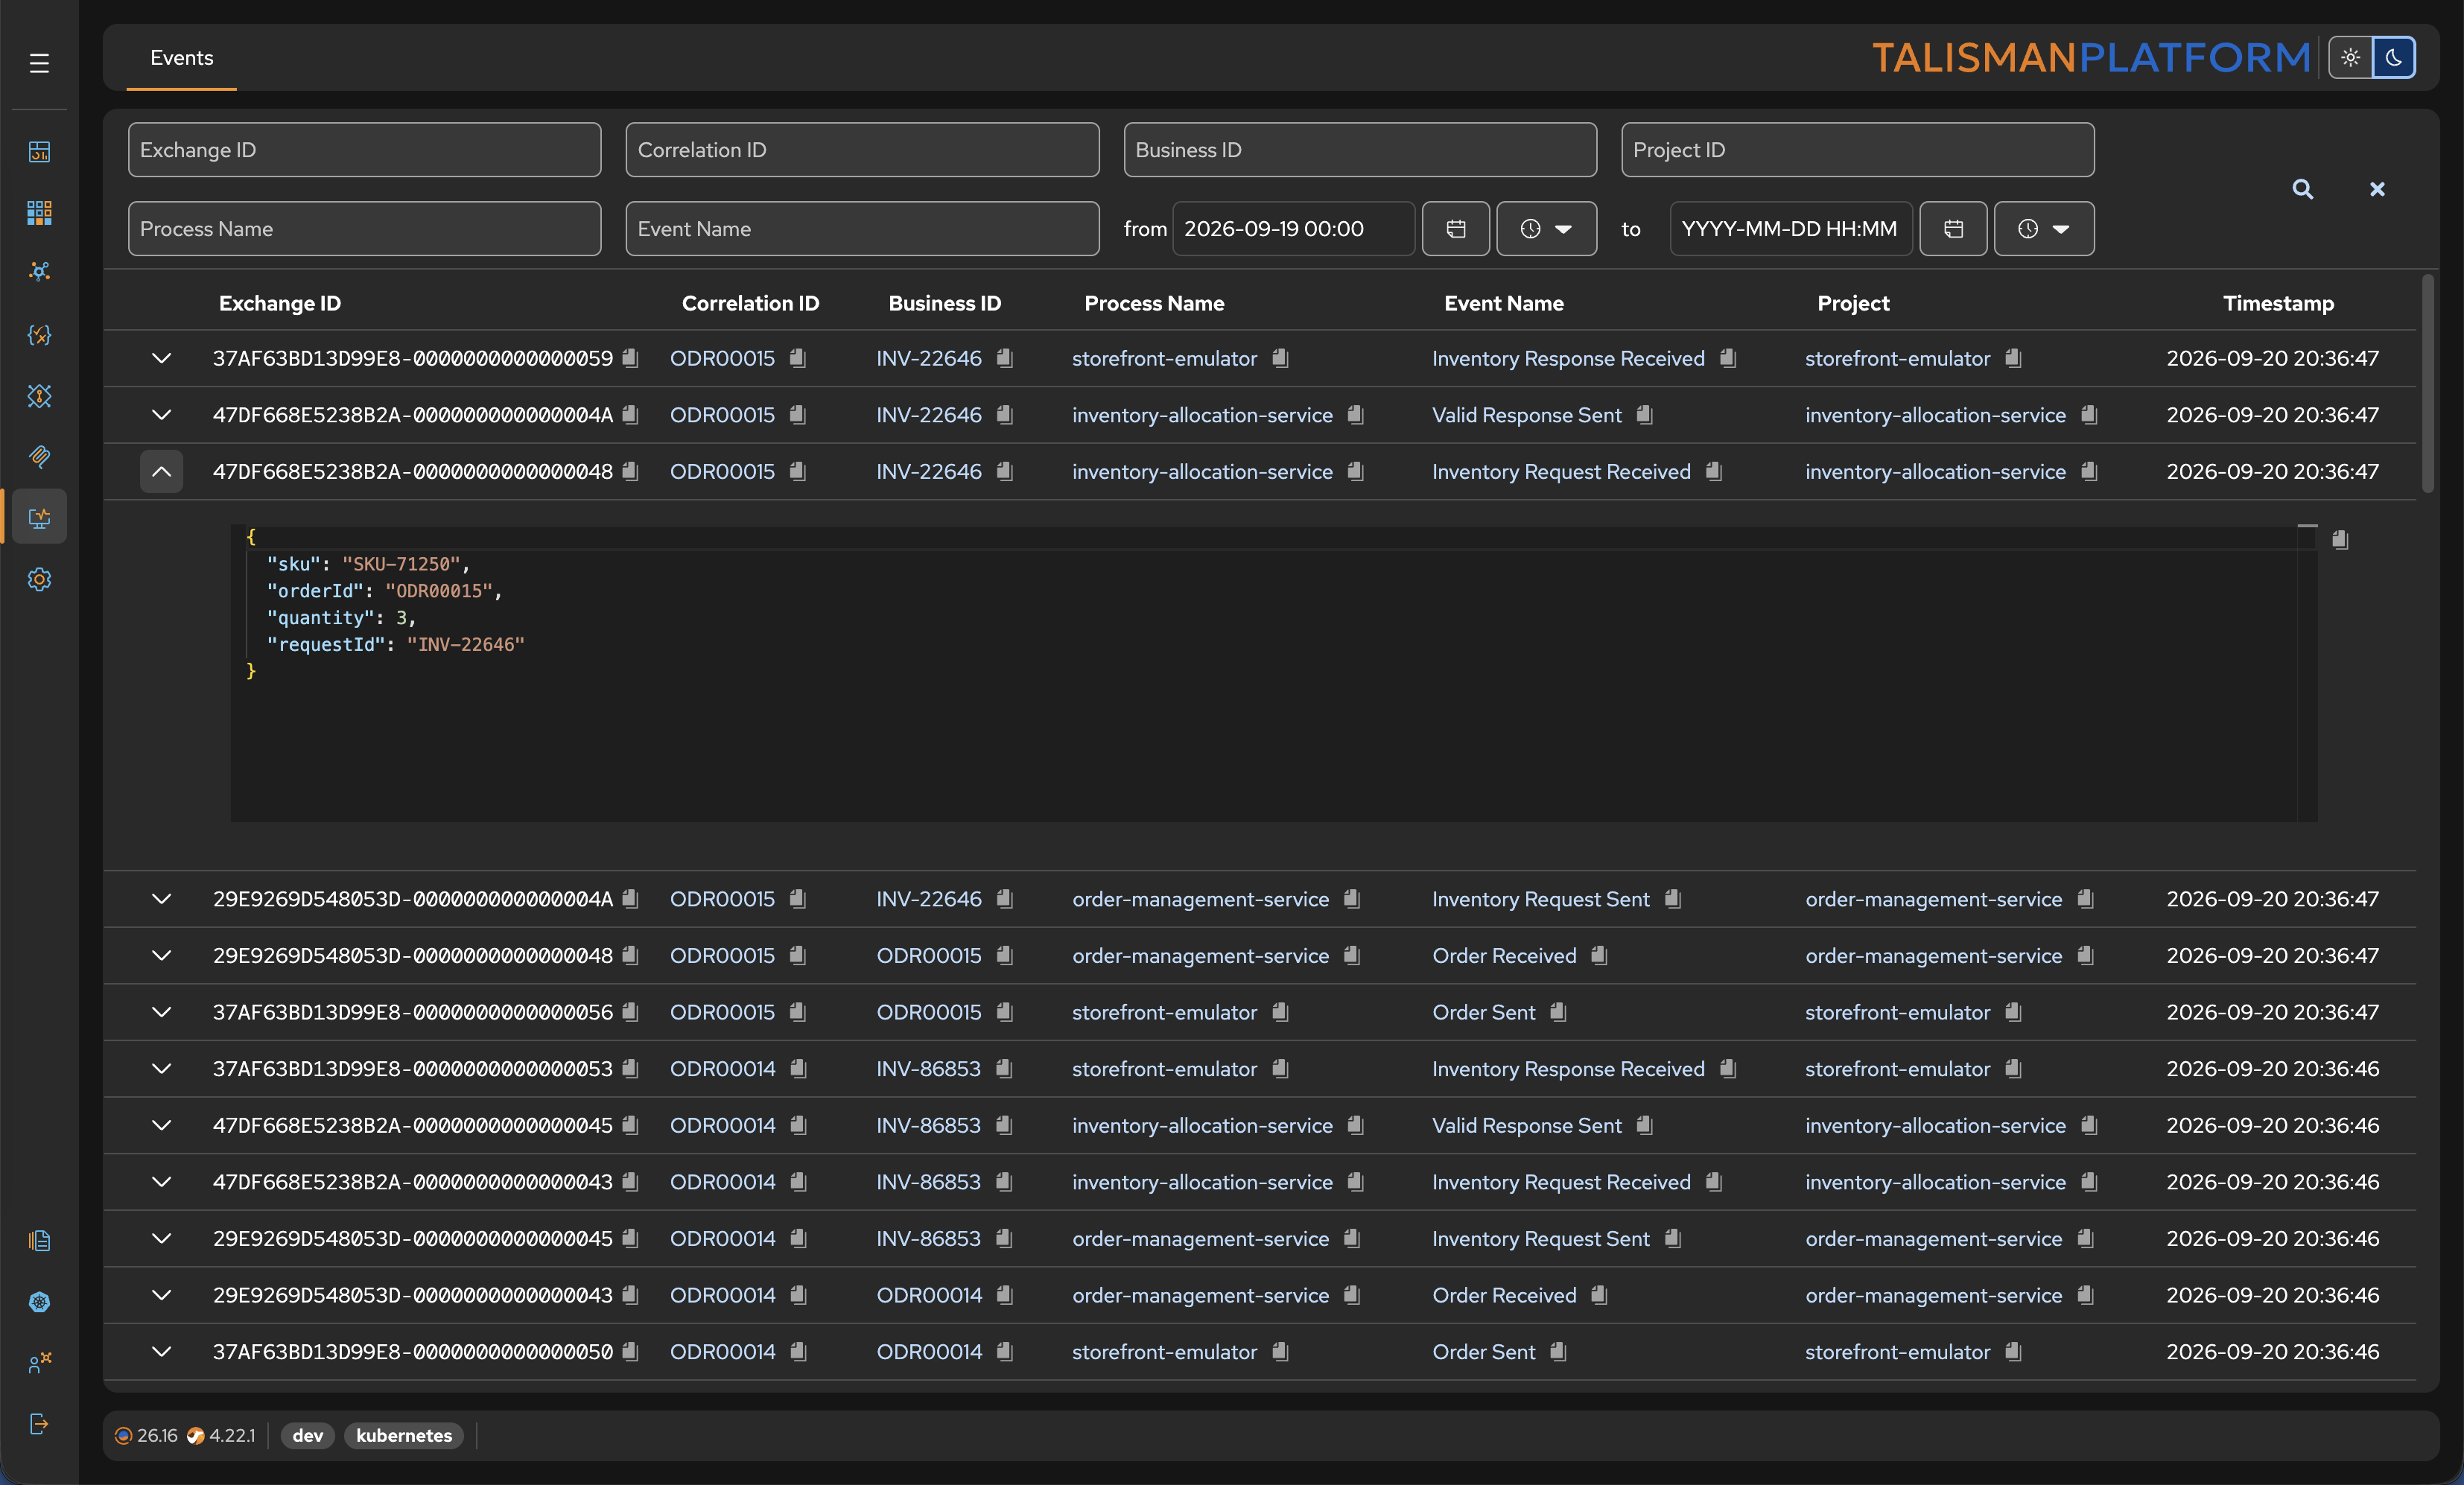
Each event is stored with:
| Field | Purpose |
|---|---|
eventName |
the business event, e.g. OrderReceived |
businessId |
your own key — order number, customer id, invoice number |
correlationId |
ties together the steps of one distributed business transaction |
processName |
the business process the event belongs to |
projectId |
the integration that emitted the event |
exchangeId |
the Camel exchange, linking the business event to the technical trace |
eventTimestamp |
when it happened |
eventData |
arbitrary JSON payload (stored as JSONB, queryable) |
Events are persisted in the platform database and de-duplicated by a uniqueness constraint over the identity fields, so a retried or redelivered exchange does not inflate the timeline. Correlation id, business id and timestamp are indexed for fast lookup on large volumes.
The BAM page lets operators and business users filter events by correlation id, business id, event name, process name, project, exchange id and a time range, then expand any row to see the full event payload. The same query is available through the API:
Supply-Chain Reports
Two further per-project reports are kept alongside the runtime signals and are worth including in an operational review:
- Vulnerability reports — scan results for a built image, stored per project, commit, image tag and digest.
- Dependency reports — the resolved dependency set of a build.
Integrating with existing stack
Talisman's built-in observability is intentionally self-contained, but it does not replace or block a central monitoring platform — the integrations expose standard endpoints, so:
- point Prometheus (or any OTLP/Prometheus-compatible collector) at port
9876, path/observe/metrics, on the containers or pods Talisman deploys; - use
/observe/healthfor external liveness/readiness probing and alerting; - enable OpenTelemetry tracing in a project — the observability services are already on the classpath, so exporting to your collector is a matter of configuration rather than a rebuild;
- ship container logs with your existing log shipper: Talisman writes nothing to a proprietary log format.
You own the runtime, the images and the endpoints, so the same integrations can be monitored by Talisman, by your enterprise stack, or by both.